
You can not select more than 25 topics
Topics must start with a letter or number, can include dashes ('-') and can be up to 35 characters long.
 jrtechs
1aac397daa
jrtechs
1aac397daa
|
6 years ago | |
|---|---|---|
| doc | 7 years ago | |
| public | 6 years ago | |
| routes | 6 years ago | |
| .gitignore | 6 years ago | |
| LICENSE | 7 years ago | |
| README.md | 6 years ago | |
| gitGraph.service | 7 years ago | |
| package.json | 6 years ago | |
| run.sh | 7 years ago | |
| server.js | 6 years ago | |
README.md
Github-Graphs
Website for visualizing a persons github network.
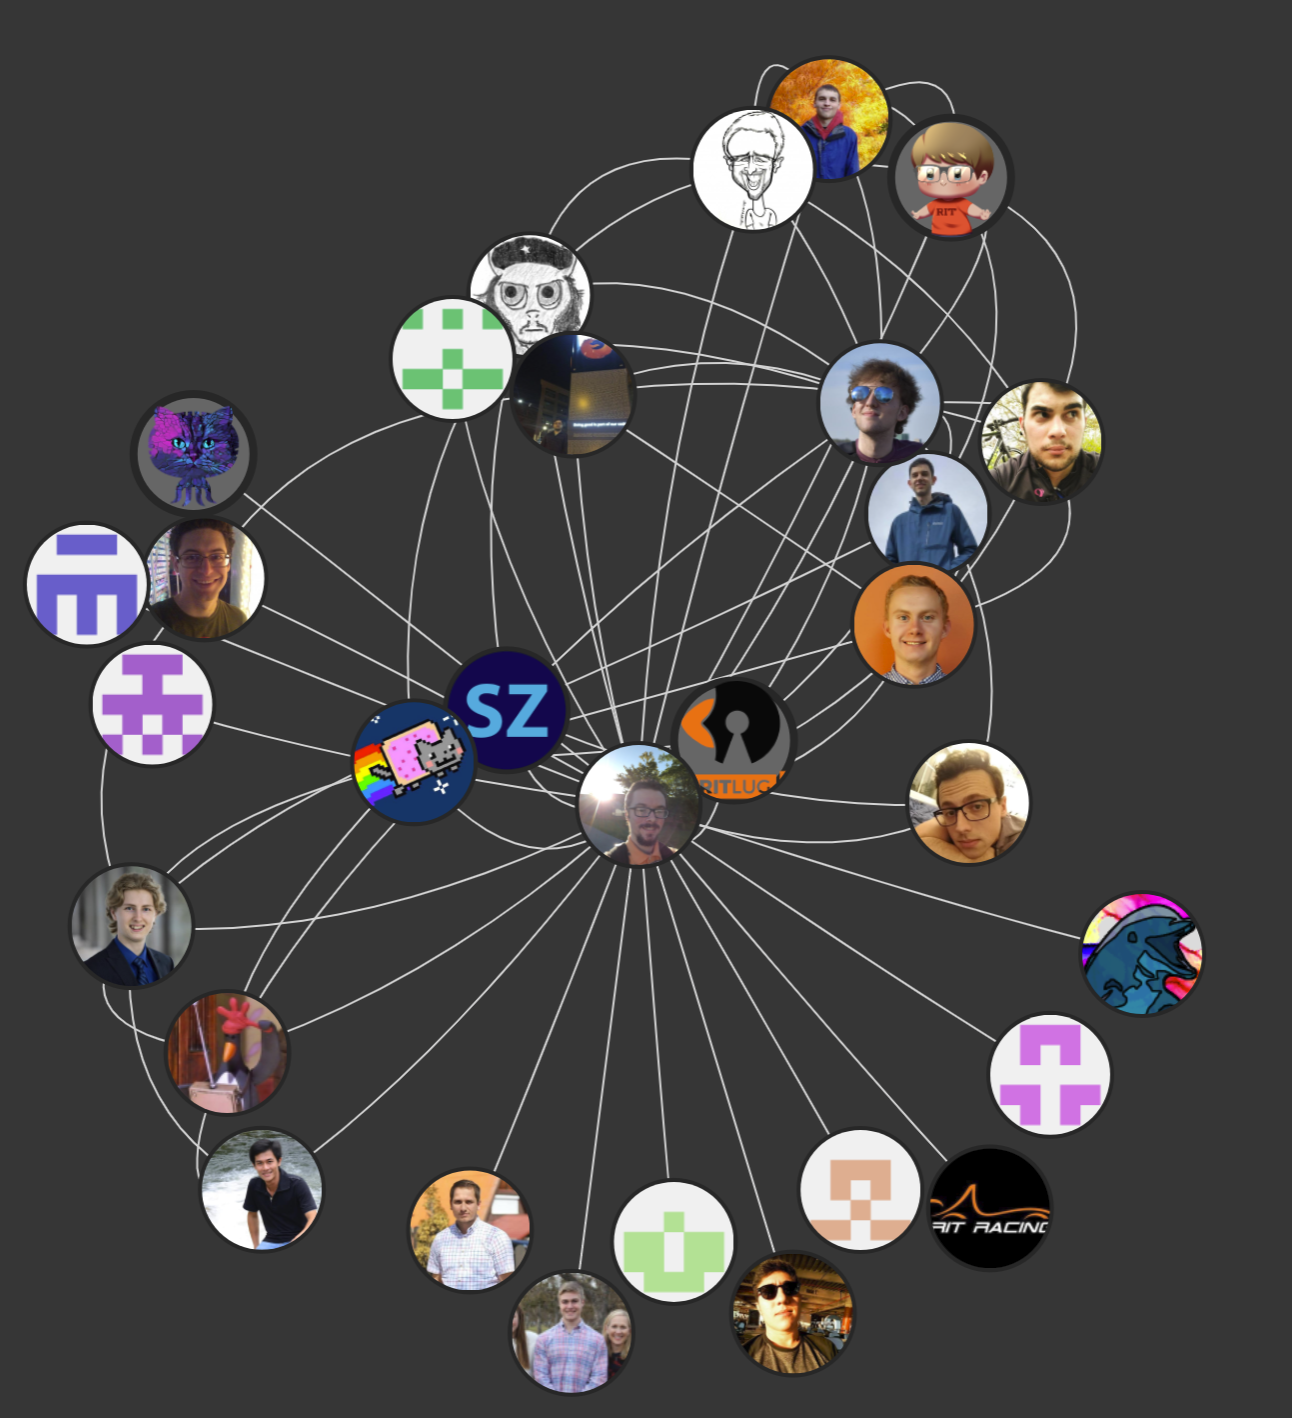
If you are lucky, you can find the site live here;
Built With

Running
Create a .env file with the code below filled in.
CLIENT_ID = <your_github_username>
CLIENT_SECRET = <your_generated_personal_access>
SESSION_SECRET = <any_string_you_want>
PORT = <any_number>
npm install
node server.js
Contributing
We are very open to new contributors. If you want to contribute to this project, and don't know where to start, look at the open issues. Once you know what you want to work on, comment on the issue and file a pull request.