vis.js
a visual interaction system
Vis.js is a dynamic, browser based visualization library. The library is designed to be easy to use, to handle large amounts of dynamic data, and to enable manipulation of and interaction with the data. The library consists of the components DataSet, Timeline, Network, Graph2d, and Graph3d.
The vis.js library is developed by Almende B.V, as part of CHAP. Vis.js runs fine on Chrome, Firefox, Opera, Safari, IE9+, and most mobile browsers (with full touch support).
Install
npm
npm install vis
bower
bower install vis
download
Click here to download vis.js (version 3.1.0)Example
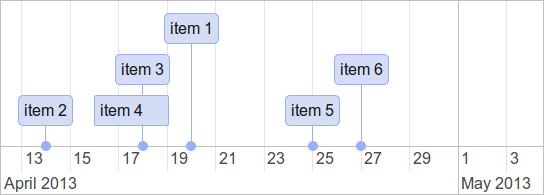
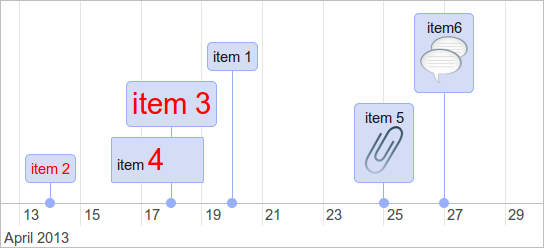
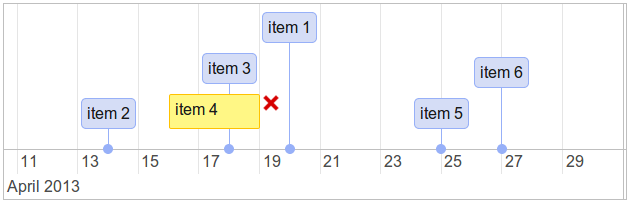
A basic example demonstrating how to use the vis.js timeline is shown below. See the gallery below for more examples.
<!doctype html>
<html>
<head>
  <link href="http://visjs.org/dist/vis.css" rel="stylesheet" type="text/css" />
  <script src="http://visjs.org/dist/vis.js"></script>
</head>
<body>
  <div id="mytimeline"></div>

  <script type="text/javascript">
    // DOM element where the Timeline will be attached
    var container = document.getElementById('mytimeline');

    // Create a DataSet with data (enables two way data binding)
    var data = new vis.DataSet([
      {id: 1, content: 'item 1', start: '2013-04-20'},
      {id: 2, content: 'item 2', start: '2013-04-14'},
      {id: 3, content: 'item 3', start: '2013-04-18'},
      {id: 4, content: 'item 4', start: '2013-04-16', end: '2013-04-19'},
      {id: 5, content: 'item 5', start: '2013-04-25'},
      {id: 6, content: 'item 6', start: '2013-04-27'}
    ]);

    // Configuration for the Timeline
    var options = {};

    // Create a Timeline
    var timeline = new vis.Timeline(container, data, options);
  </script>
</body>
</html>
Gallery
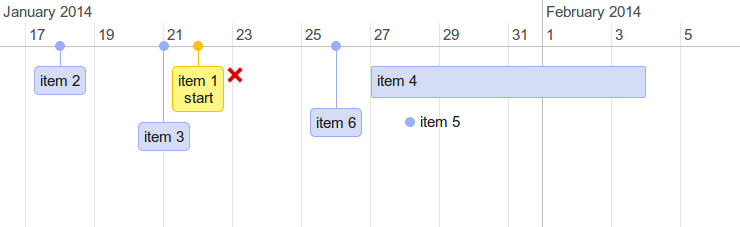
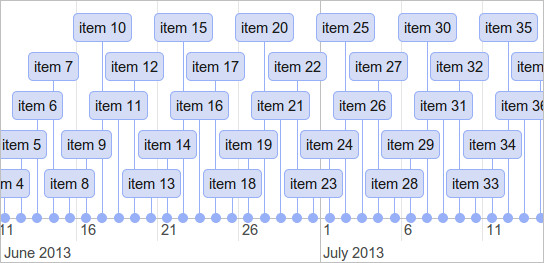
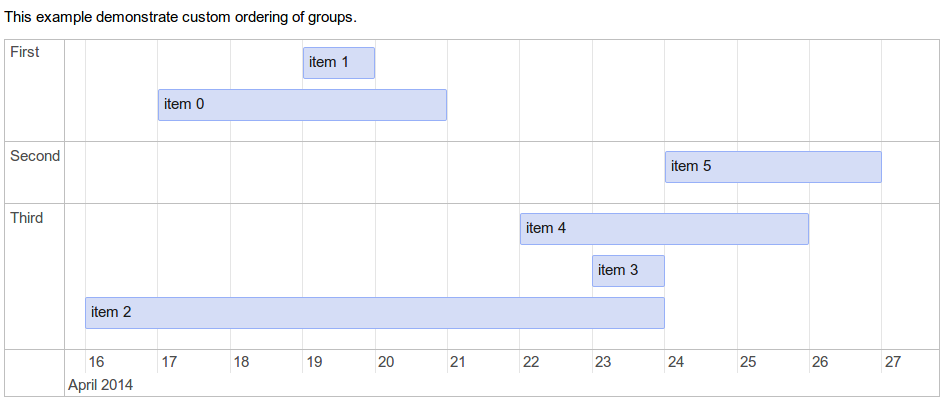
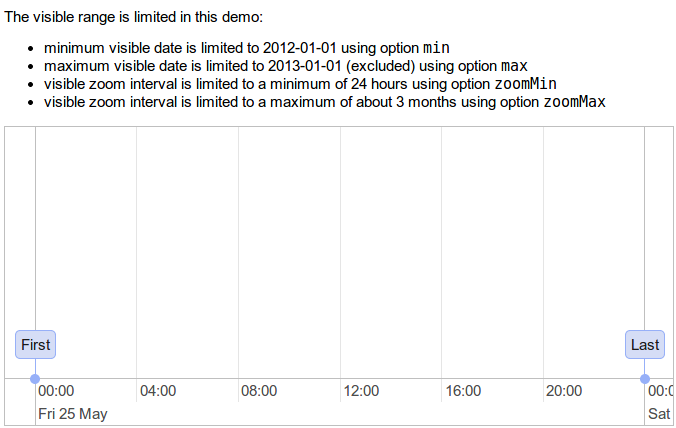
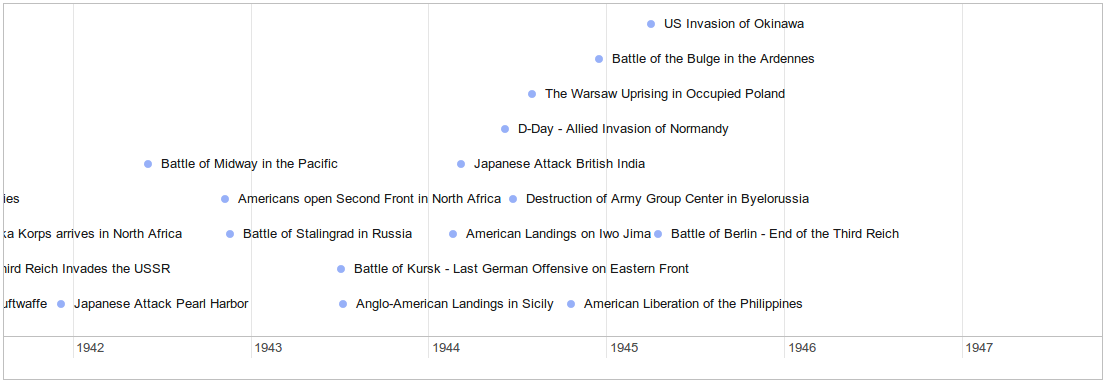
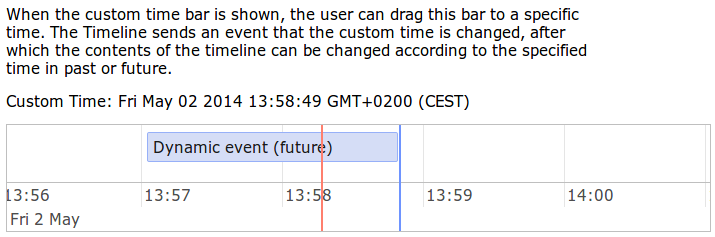
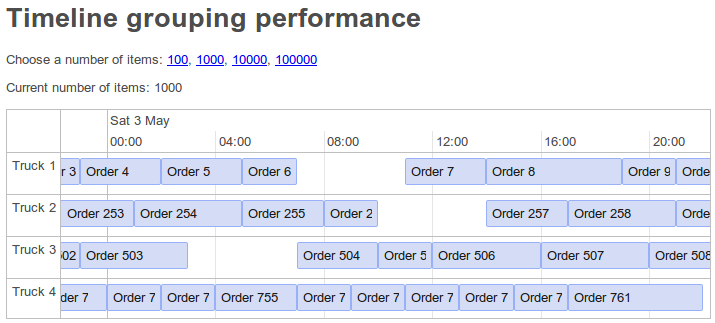
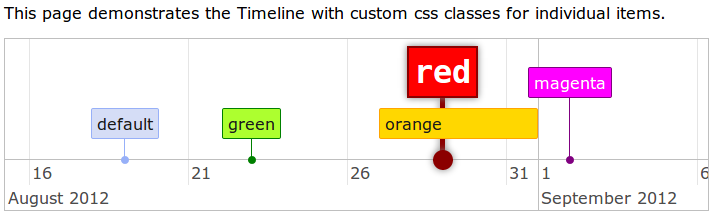
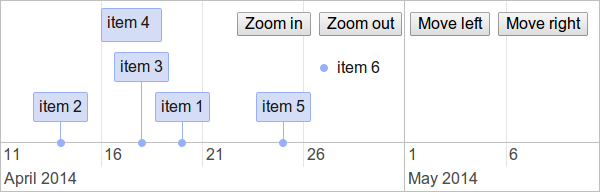
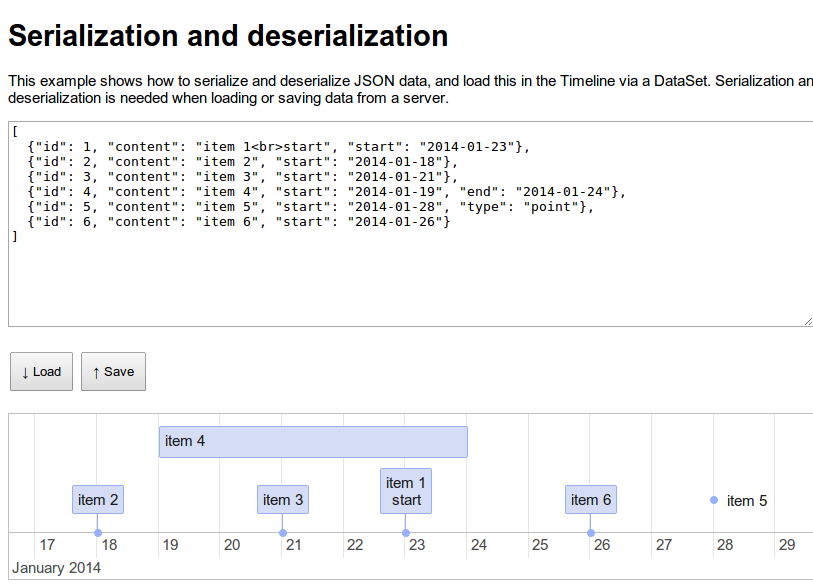
This gallery gives an idea of the features and possibilities of the library. The source code of the examples can be found in the examples directory.Timeline
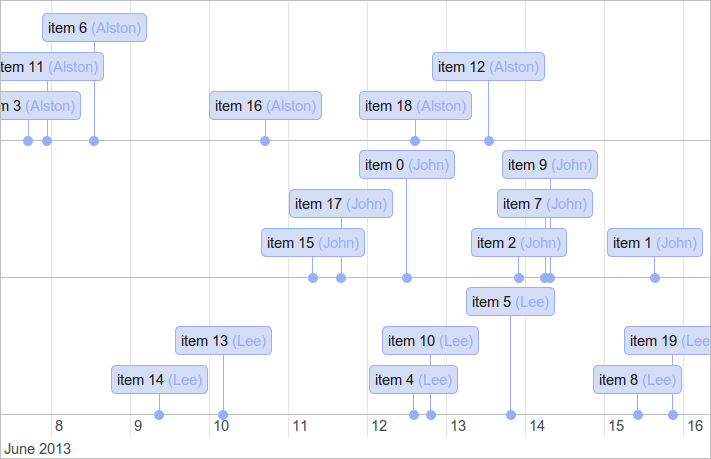
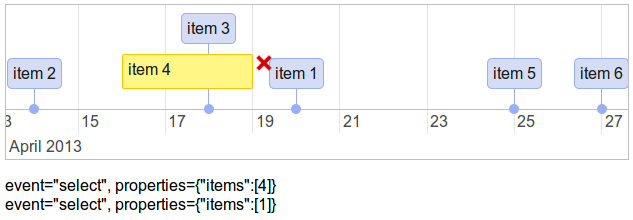
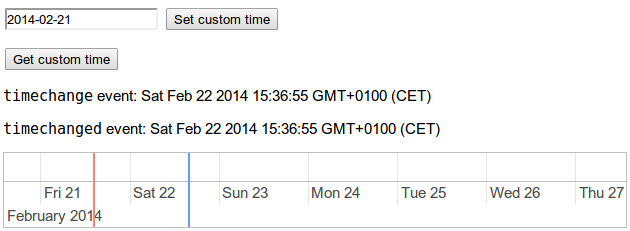
The timeline from vis.js displays different types of data on a timeline.

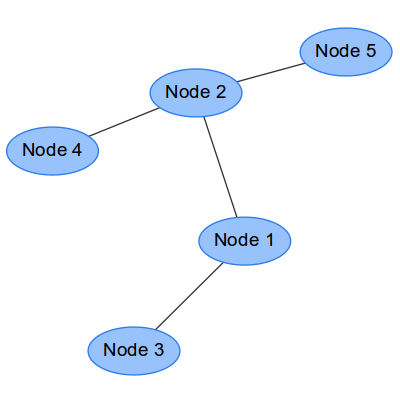
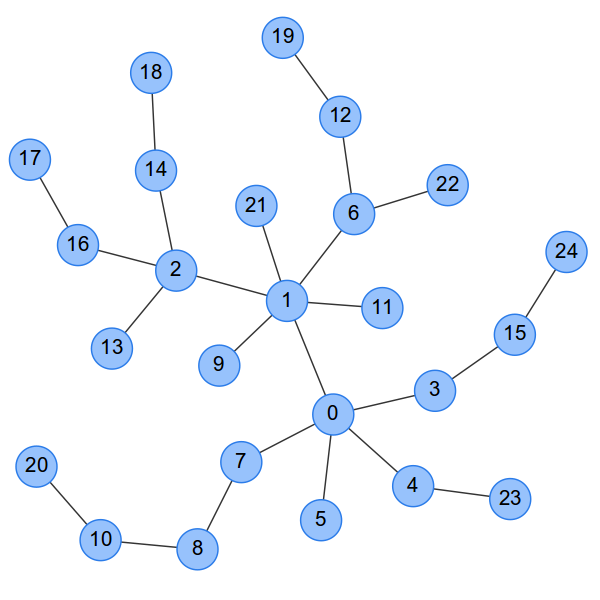
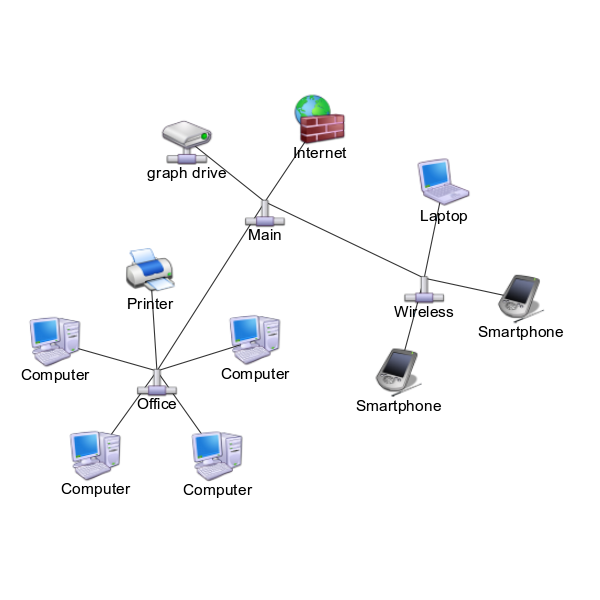
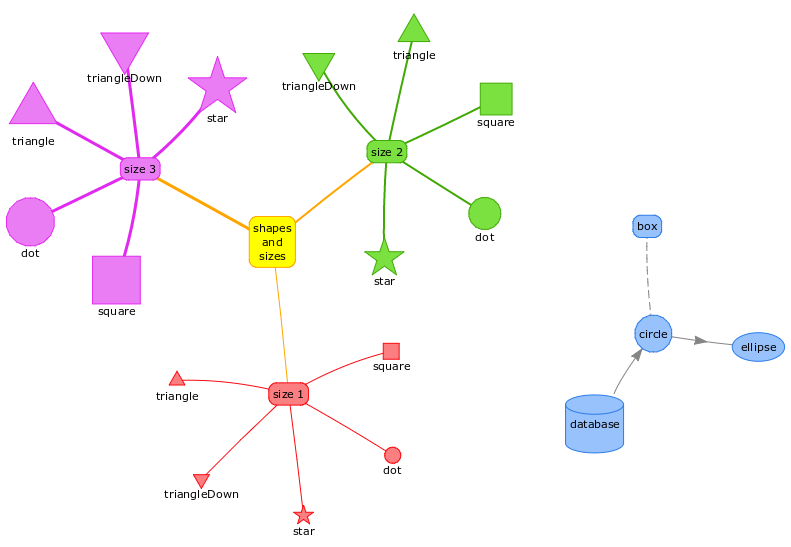
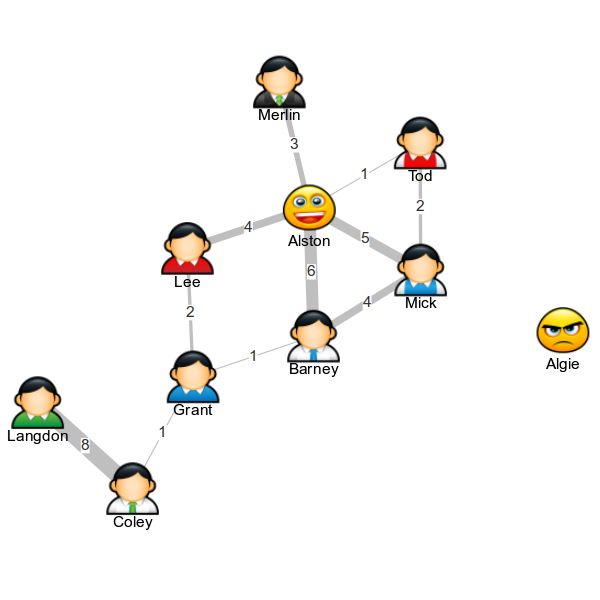
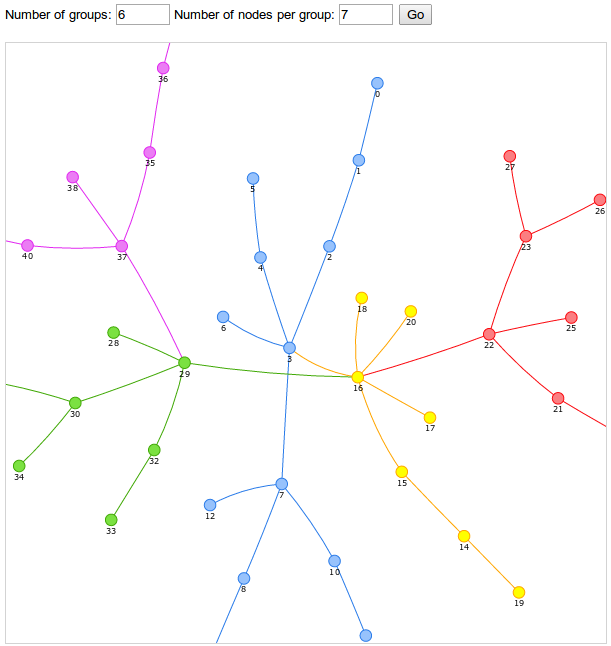
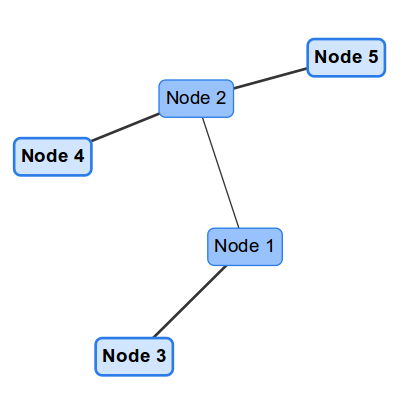
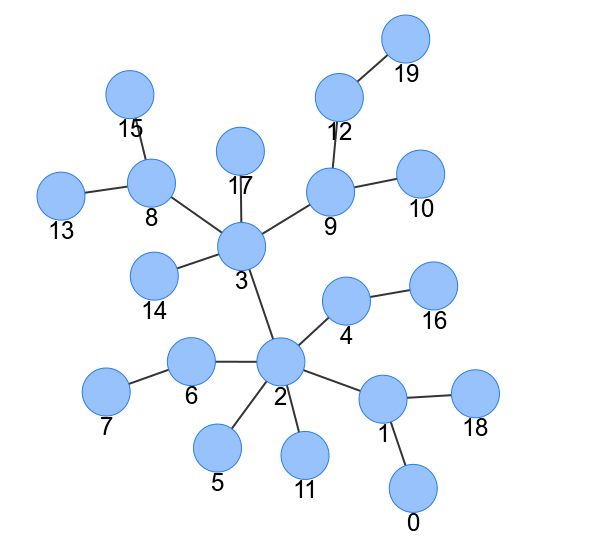
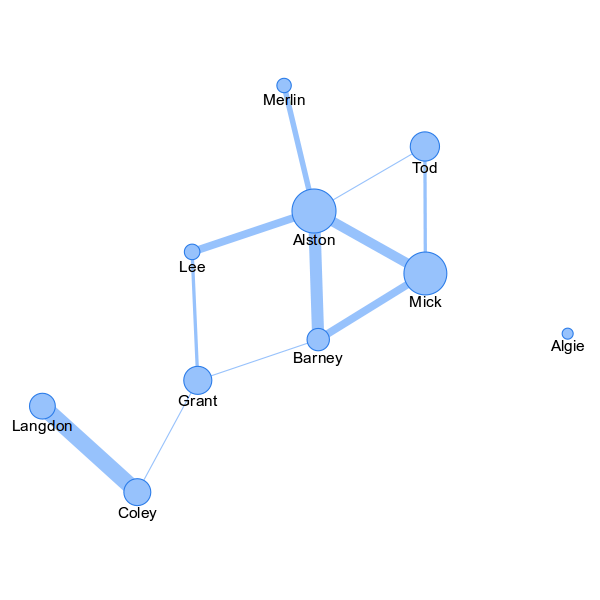
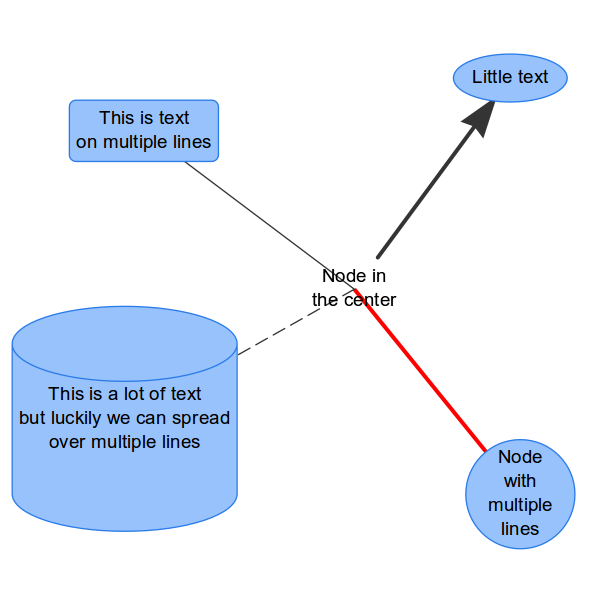
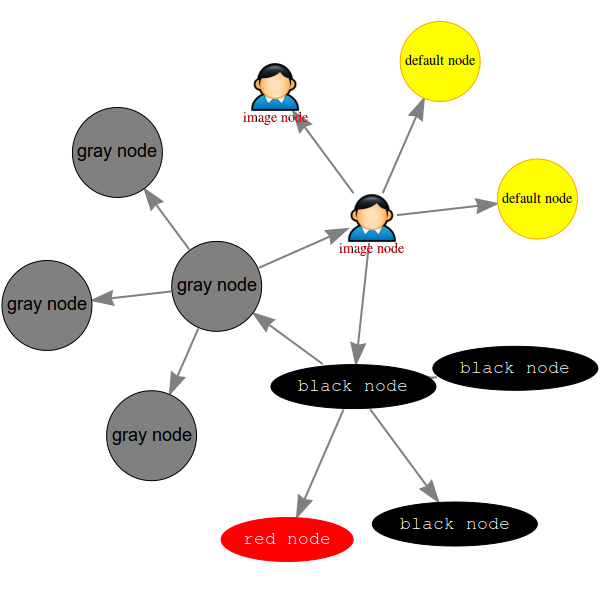
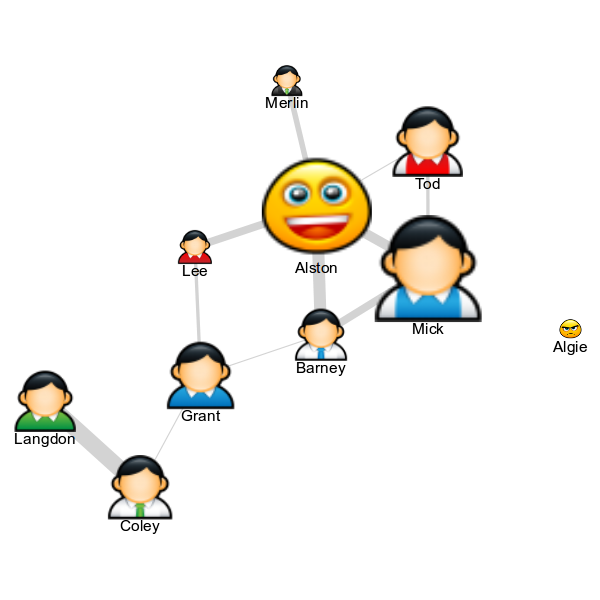
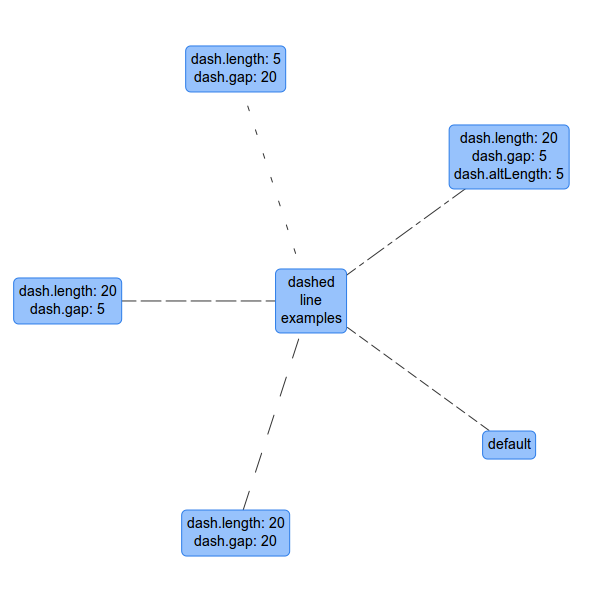
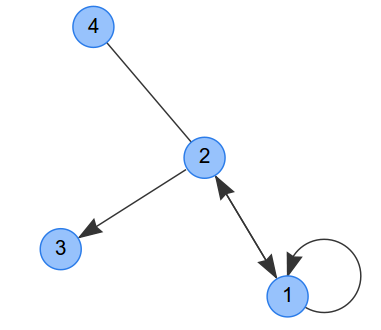
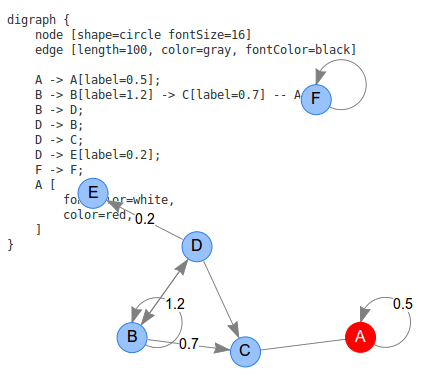
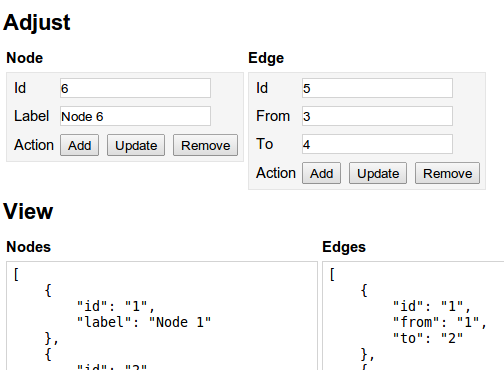
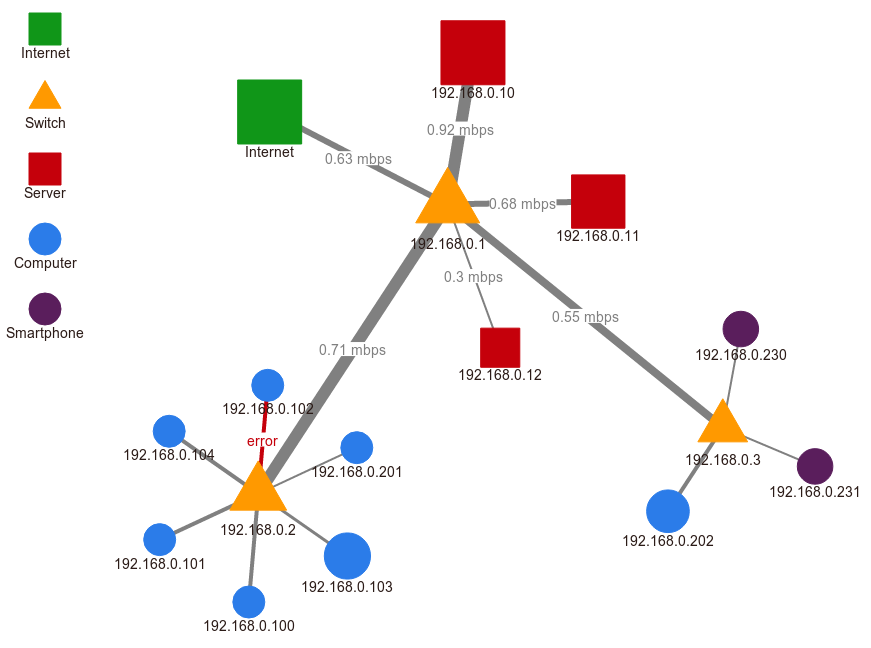
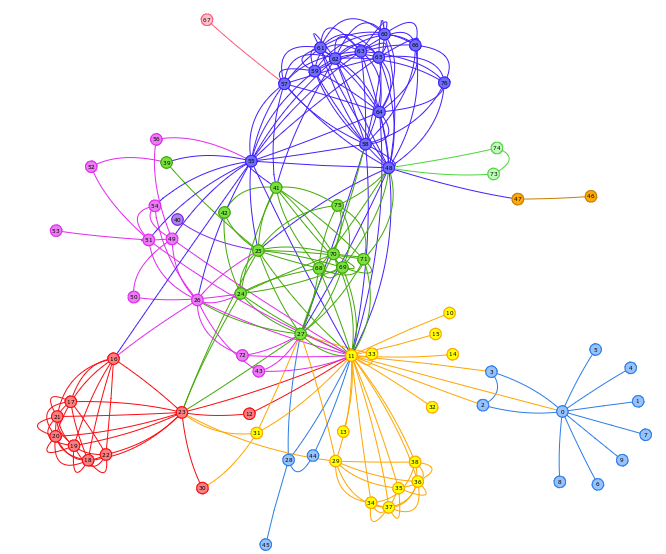
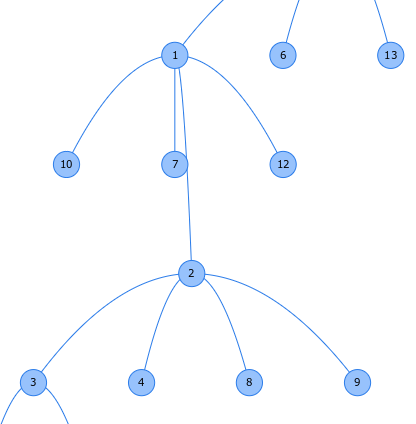
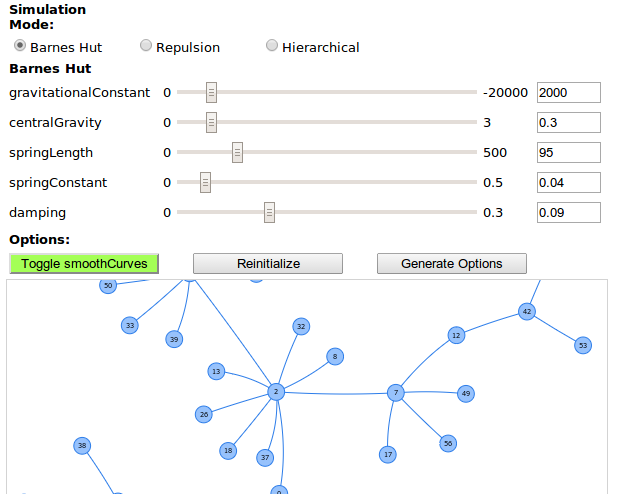
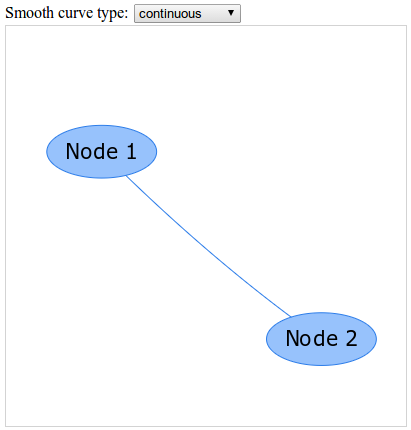
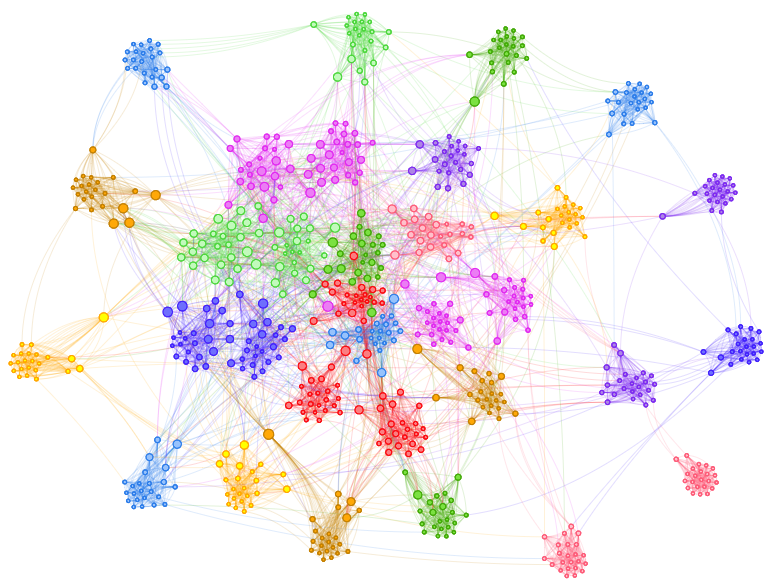
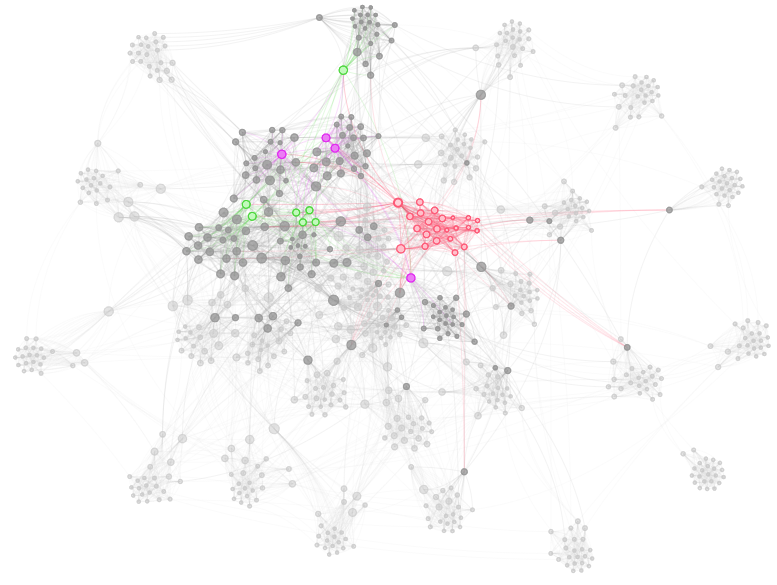
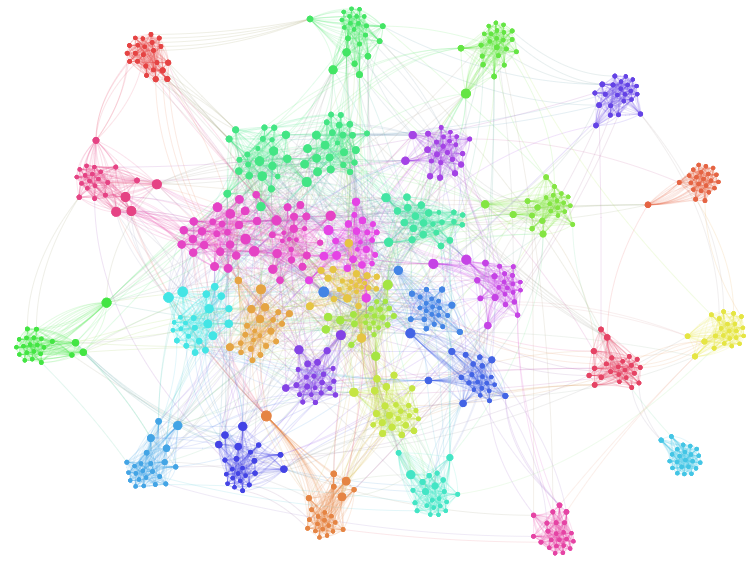
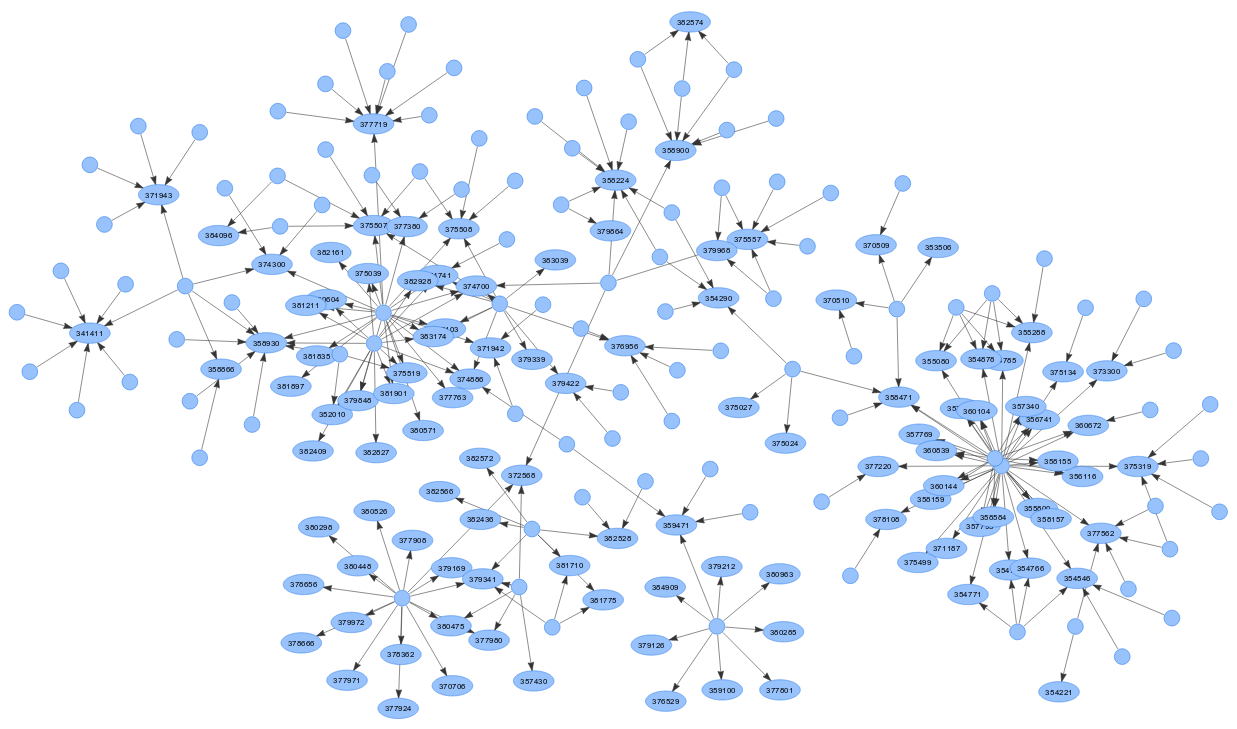
Network
The Network visualization visualizes graphs and networks with customizable styles.


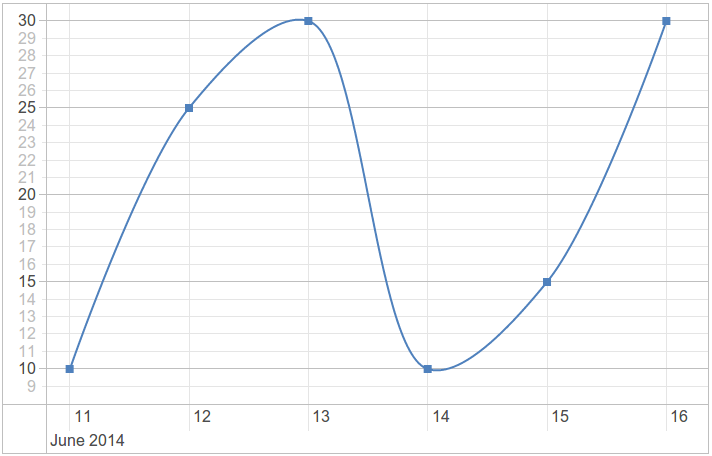
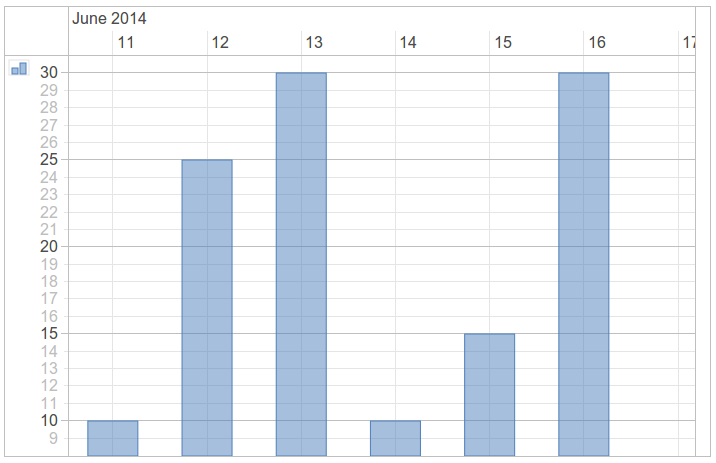
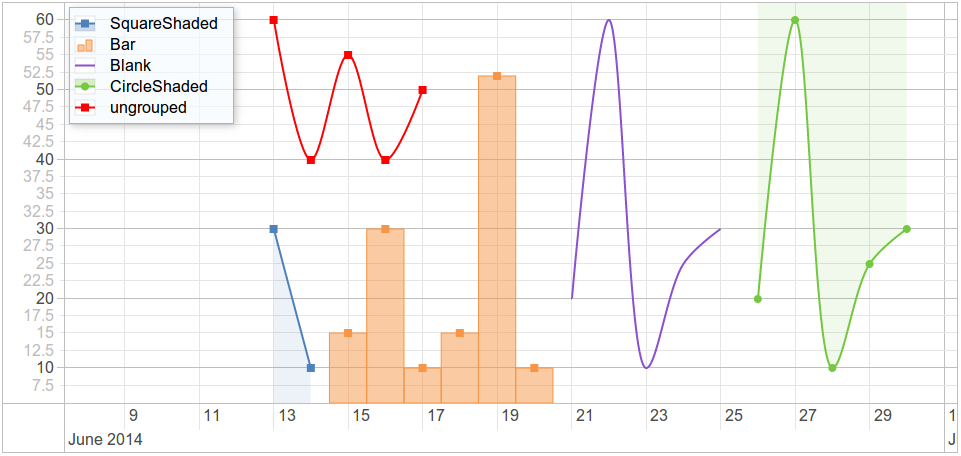
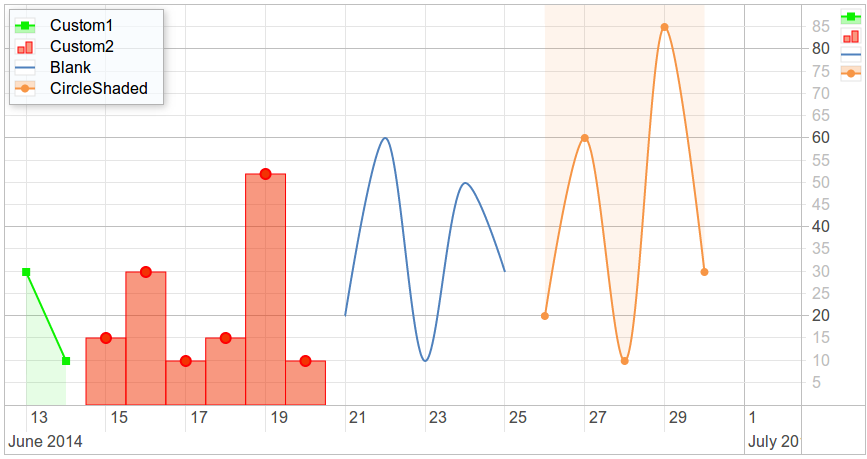
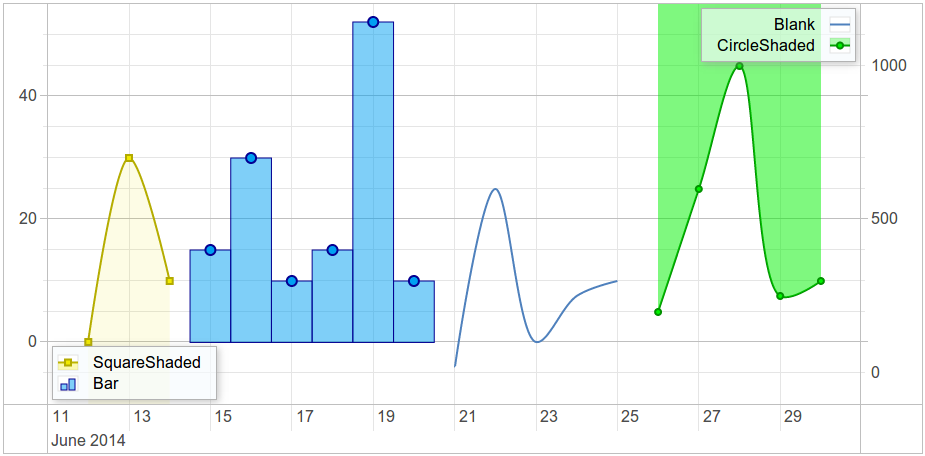
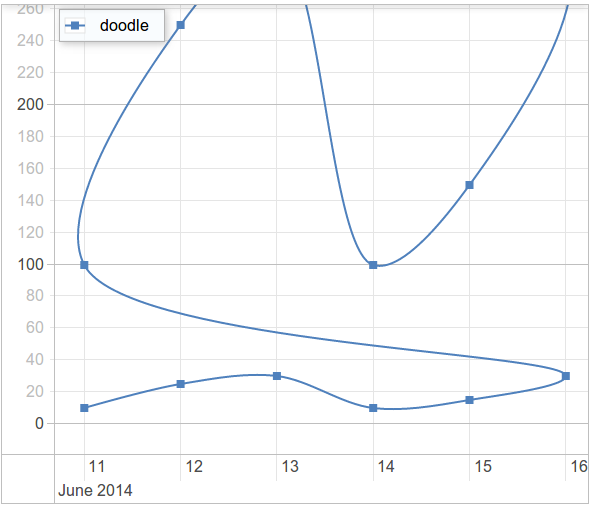
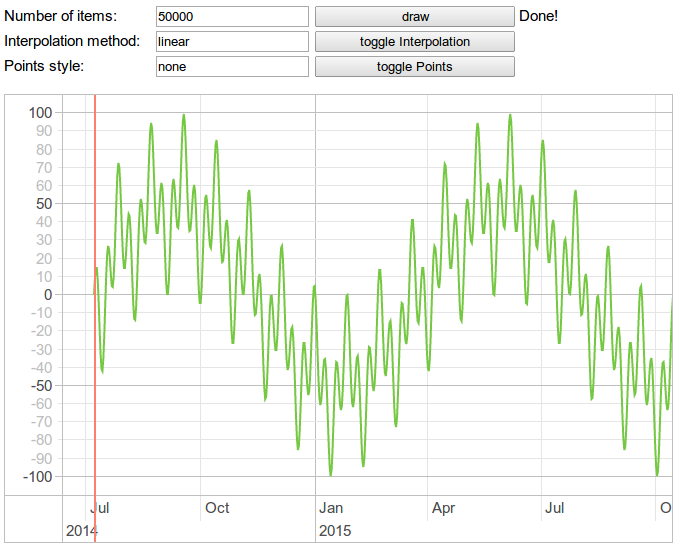
Graph2d
The Graph2d visualizes bars and lines in time.

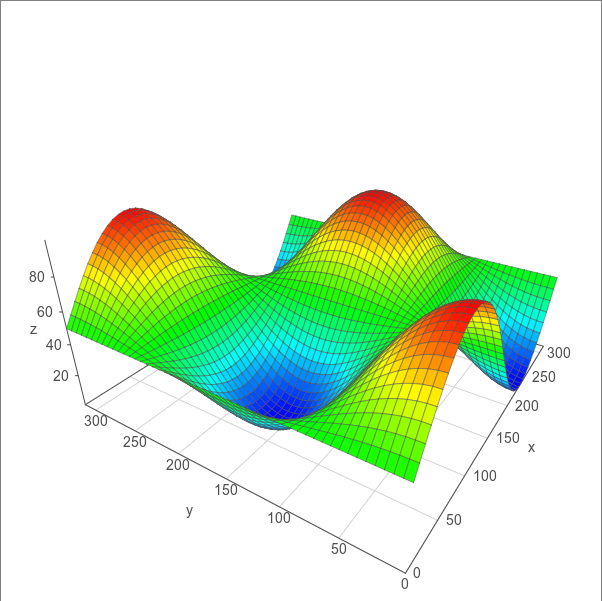
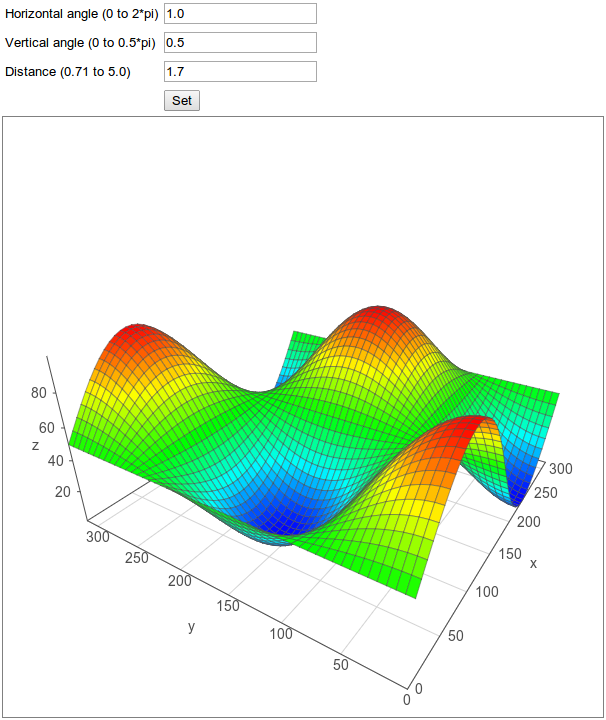
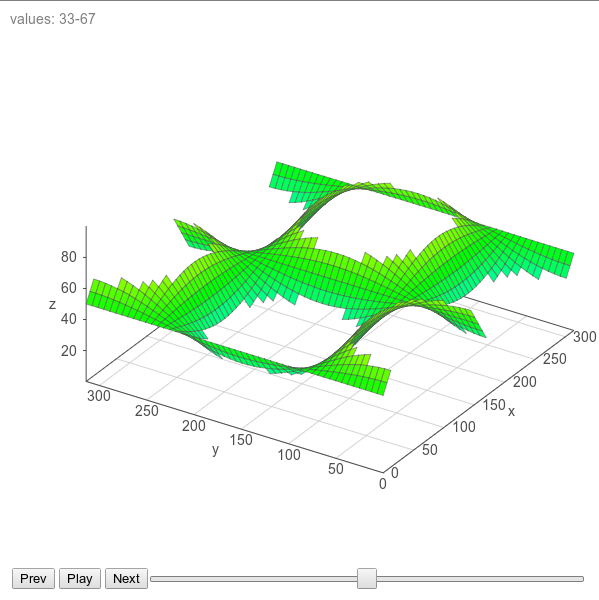
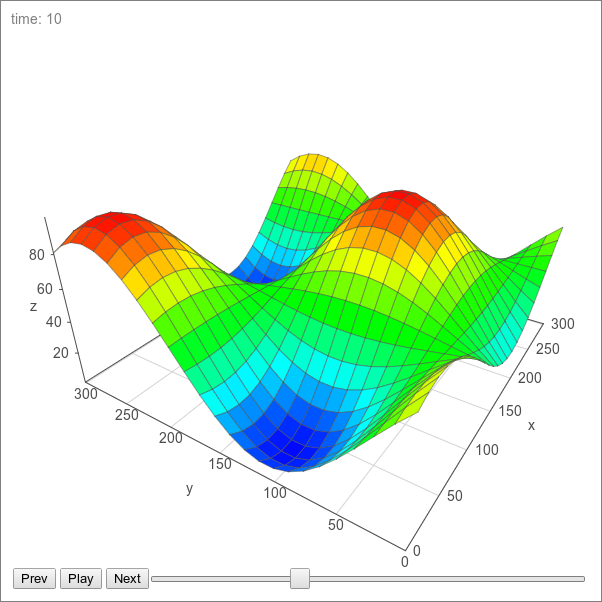
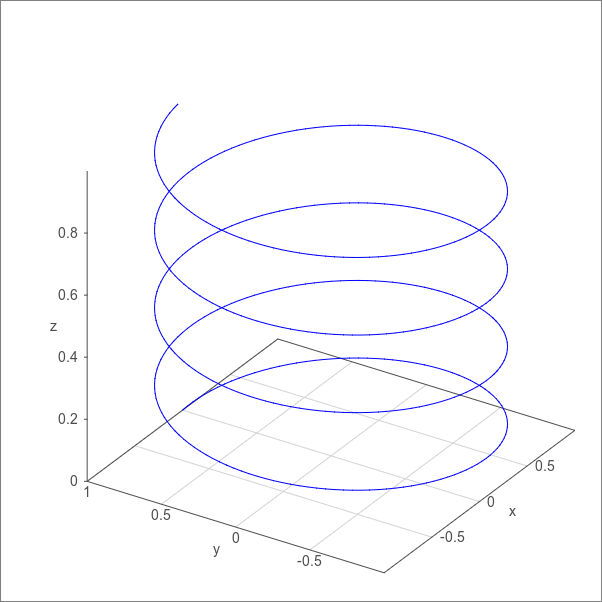
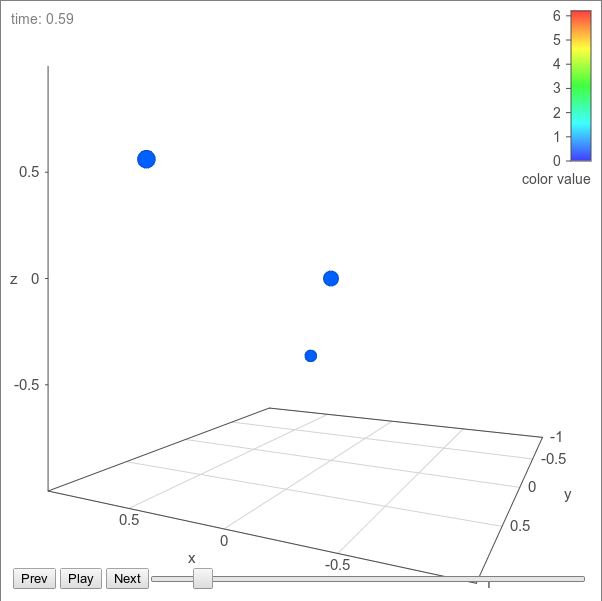
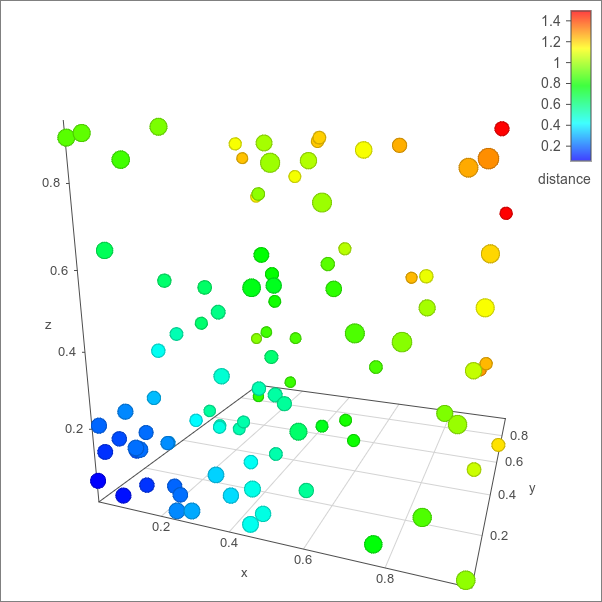
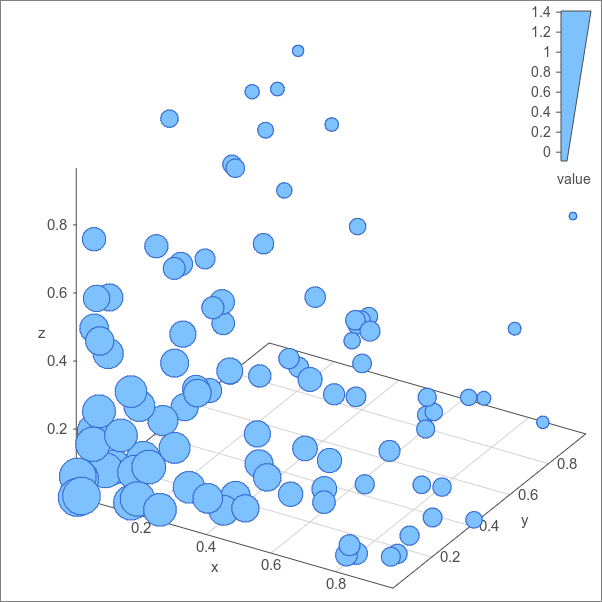
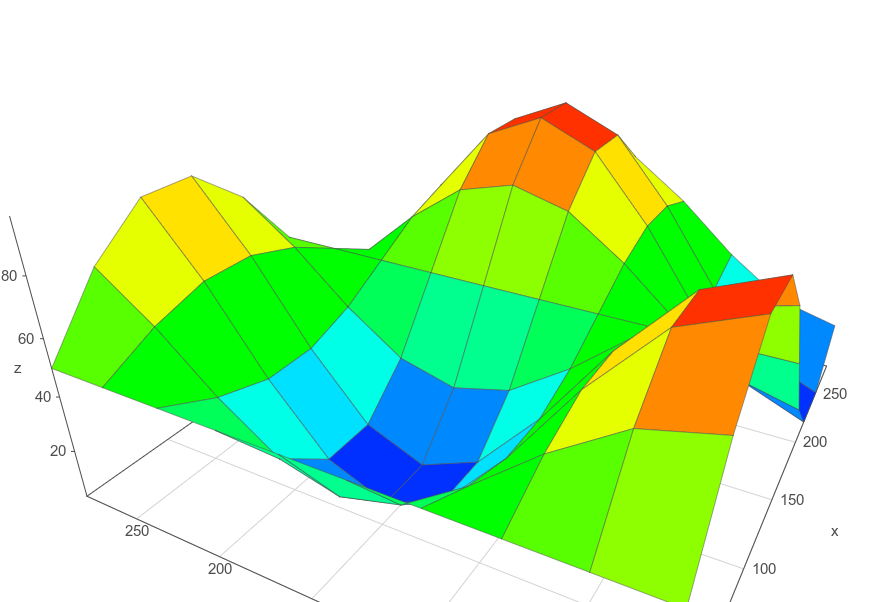
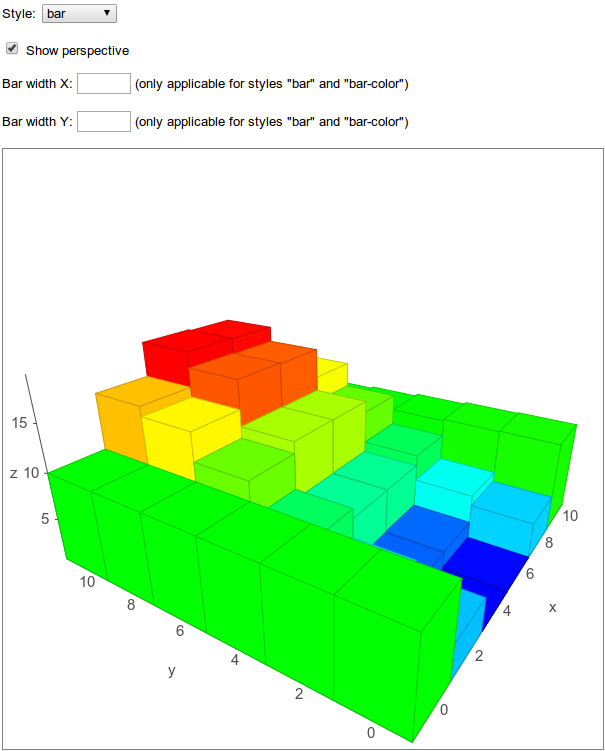
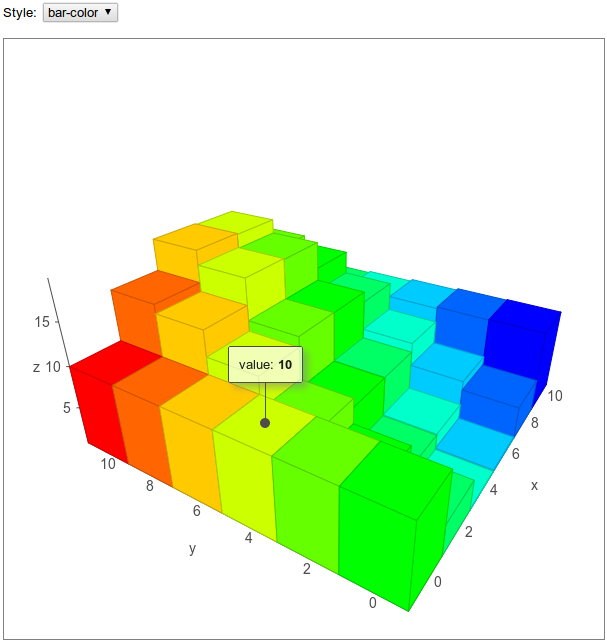
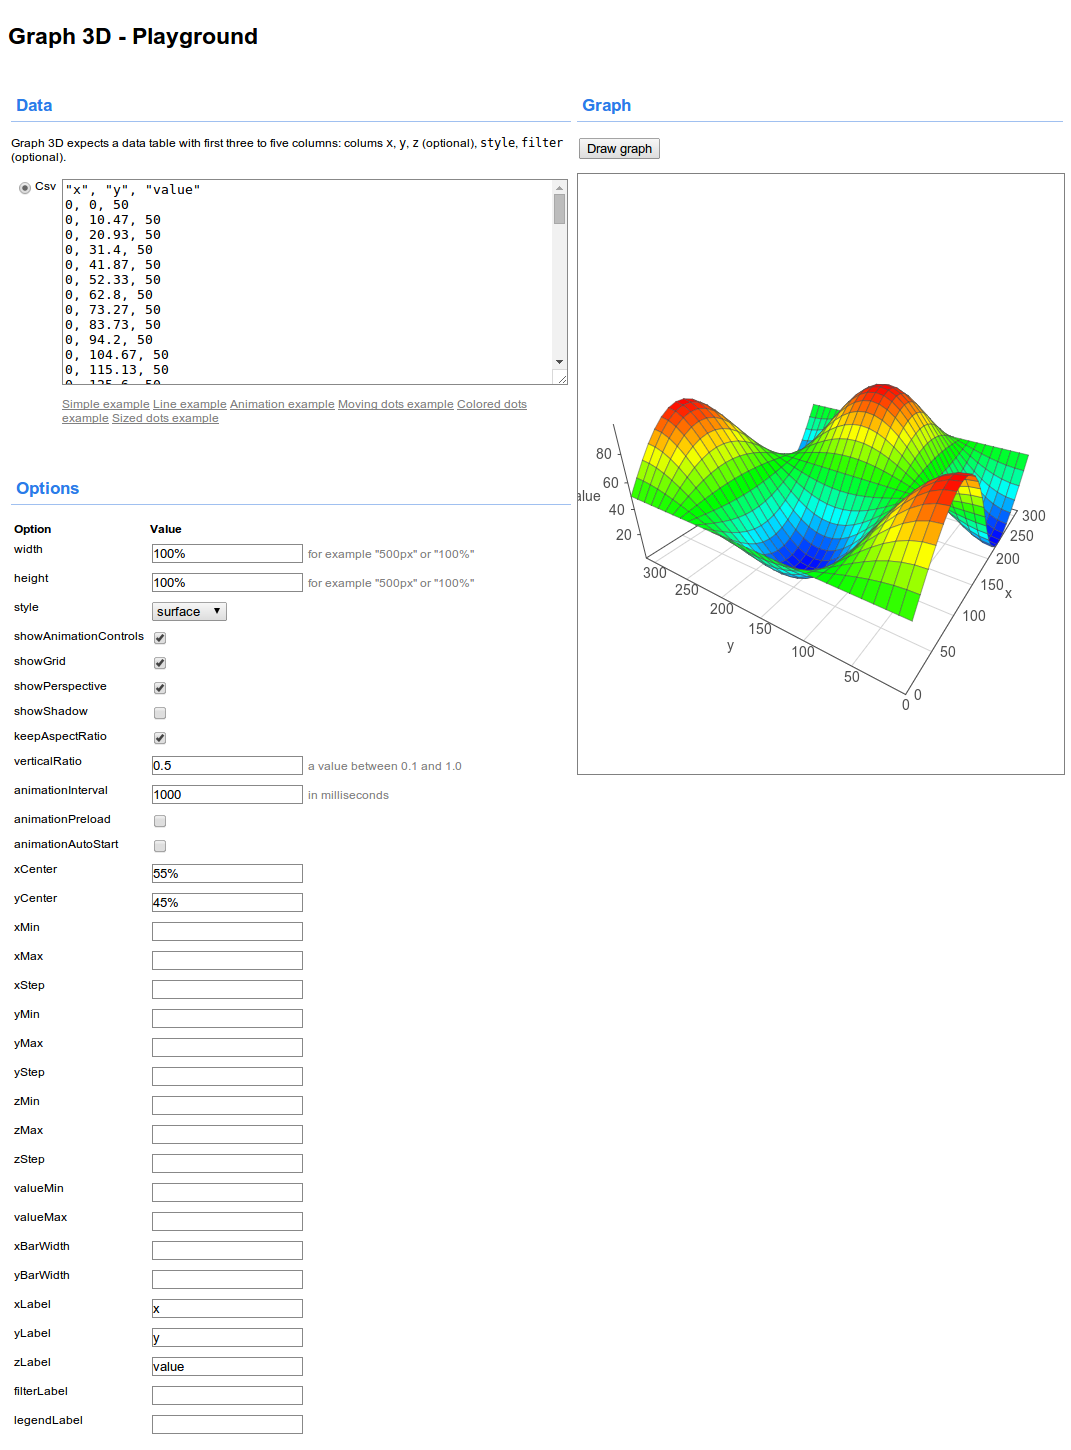
Graph3d
The Graph3d from vis.js visualizes three and four dimensional data.
Docs
Documentation is available here: Documentation
License
Copyright (C) 2010-2014 Almende B.V.
Licensed under the Apache License, Version 2.0 (the "License"); you may not use this file except in compliance with the License. You may obtain a copy of the License at
http://www.apache.org/licenses/LICENSE-2.0
Unless required by applicable law or agreed to in writing, software distributed under the License is distributed on an "AS IS" BASIS, WITHOUT WARRANTIES OR CONDITIONS OF ANY KIND, either express or implied. See the License for the specific language governing permissions and limitations under the License.