Graph2d Examples
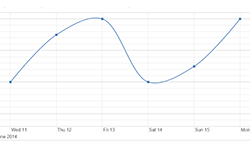
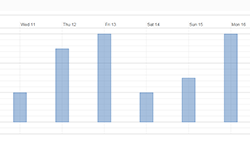
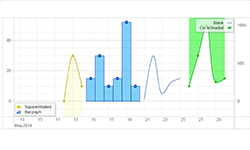
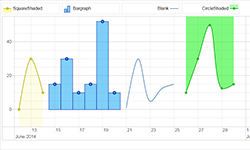
View all examples » View docs »This small code example shows the easiest way to get a Graph2d up and running. This code has been taken from example 1. The working example is shown next to it. Click it to start the interaction.
<div id="visualization"></div>
<script type="text/javascript">
var container = document.getElementById('visualization');
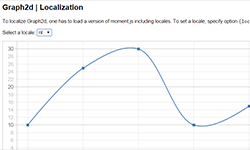
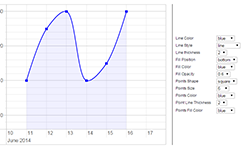
var items = [
{x: '2014-06-11', y: 10},
{x: '2014-06-12', y: 25},
{x: '2014-06-13', y: 30},
{x: '2014-06-14', y: 10},
{x: '2014-06-15', y: 15},
{x: '2014-06-16', y: 30}
];
var dataset = new vis.DataSet(items);
var options = {
start: '2014-06-10',
end: '2014-06-18'
};
var graph2d = new vis.Graph2d(container, dataset, options);
</script>